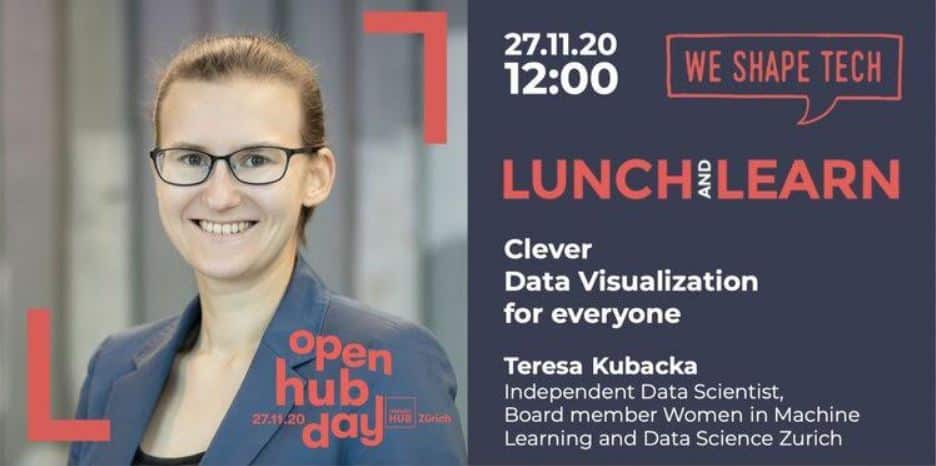
Visual of event Clever Data Visualization for Everyone by Teresa Kubacka
red_WST_logo

Take Aways: Clever Data Visualization for Everyone

Take Aways: Clever Data Visualization for Everyone

Some people just see a bunch of numbers. Few succeed in getting their visualization straight. And how do you turn a story into a chart type? Teresa Kubacka shared amazingly simple tips to do just that during the Open Hub Day by ImpactHub Zurich.

Slides

Take Aways

1

Humans are bad at interpreting abstract numbers, so it is important to use visual communication to deliver the message

2

Data can be encoded as many different visual features, not only as bars and points

3

Finding a story in the data is an exploratory process that requires many iterations

4

First think about the story you want to say, and only then pick the right chart or visual representation

5

As long as the representation is truthful, there is no absolutely “right” or “wrong” way to tell a data story – there is always a component of individual creativity
Recording

Play Video about Visual of event Clever Data Visualization for Everyone by Teresa Kubacka
Tags

Like this article?

Spread the word and share this article on social media!

Imprint          Privacy Policy          © 2021 We Shape Tech

Job

Openings

Welcoming

Diversity

Our newsletter will keep you posted on featured openings. Sign-up now!

HSLU is looking for a "Python for Data Scientists" Lecturer

HSLU is looking for a "Big Data Tools" Lecturer

Crack the Confidence Gap | 28 June 2017

Get in touch to attract diverse talent!

This website uses cookies to ensure you get the best experience on our website. Please refer to our Privacy Policy for more information.

Join Your Fellow Shapers

Don't Miss a Thing

Sign up to receive our monthly newsletter and you’ll never miss an event or insightful article!

By signing-up you agree to our Privacy Policy.